$60bn+
In AUM1 Across:
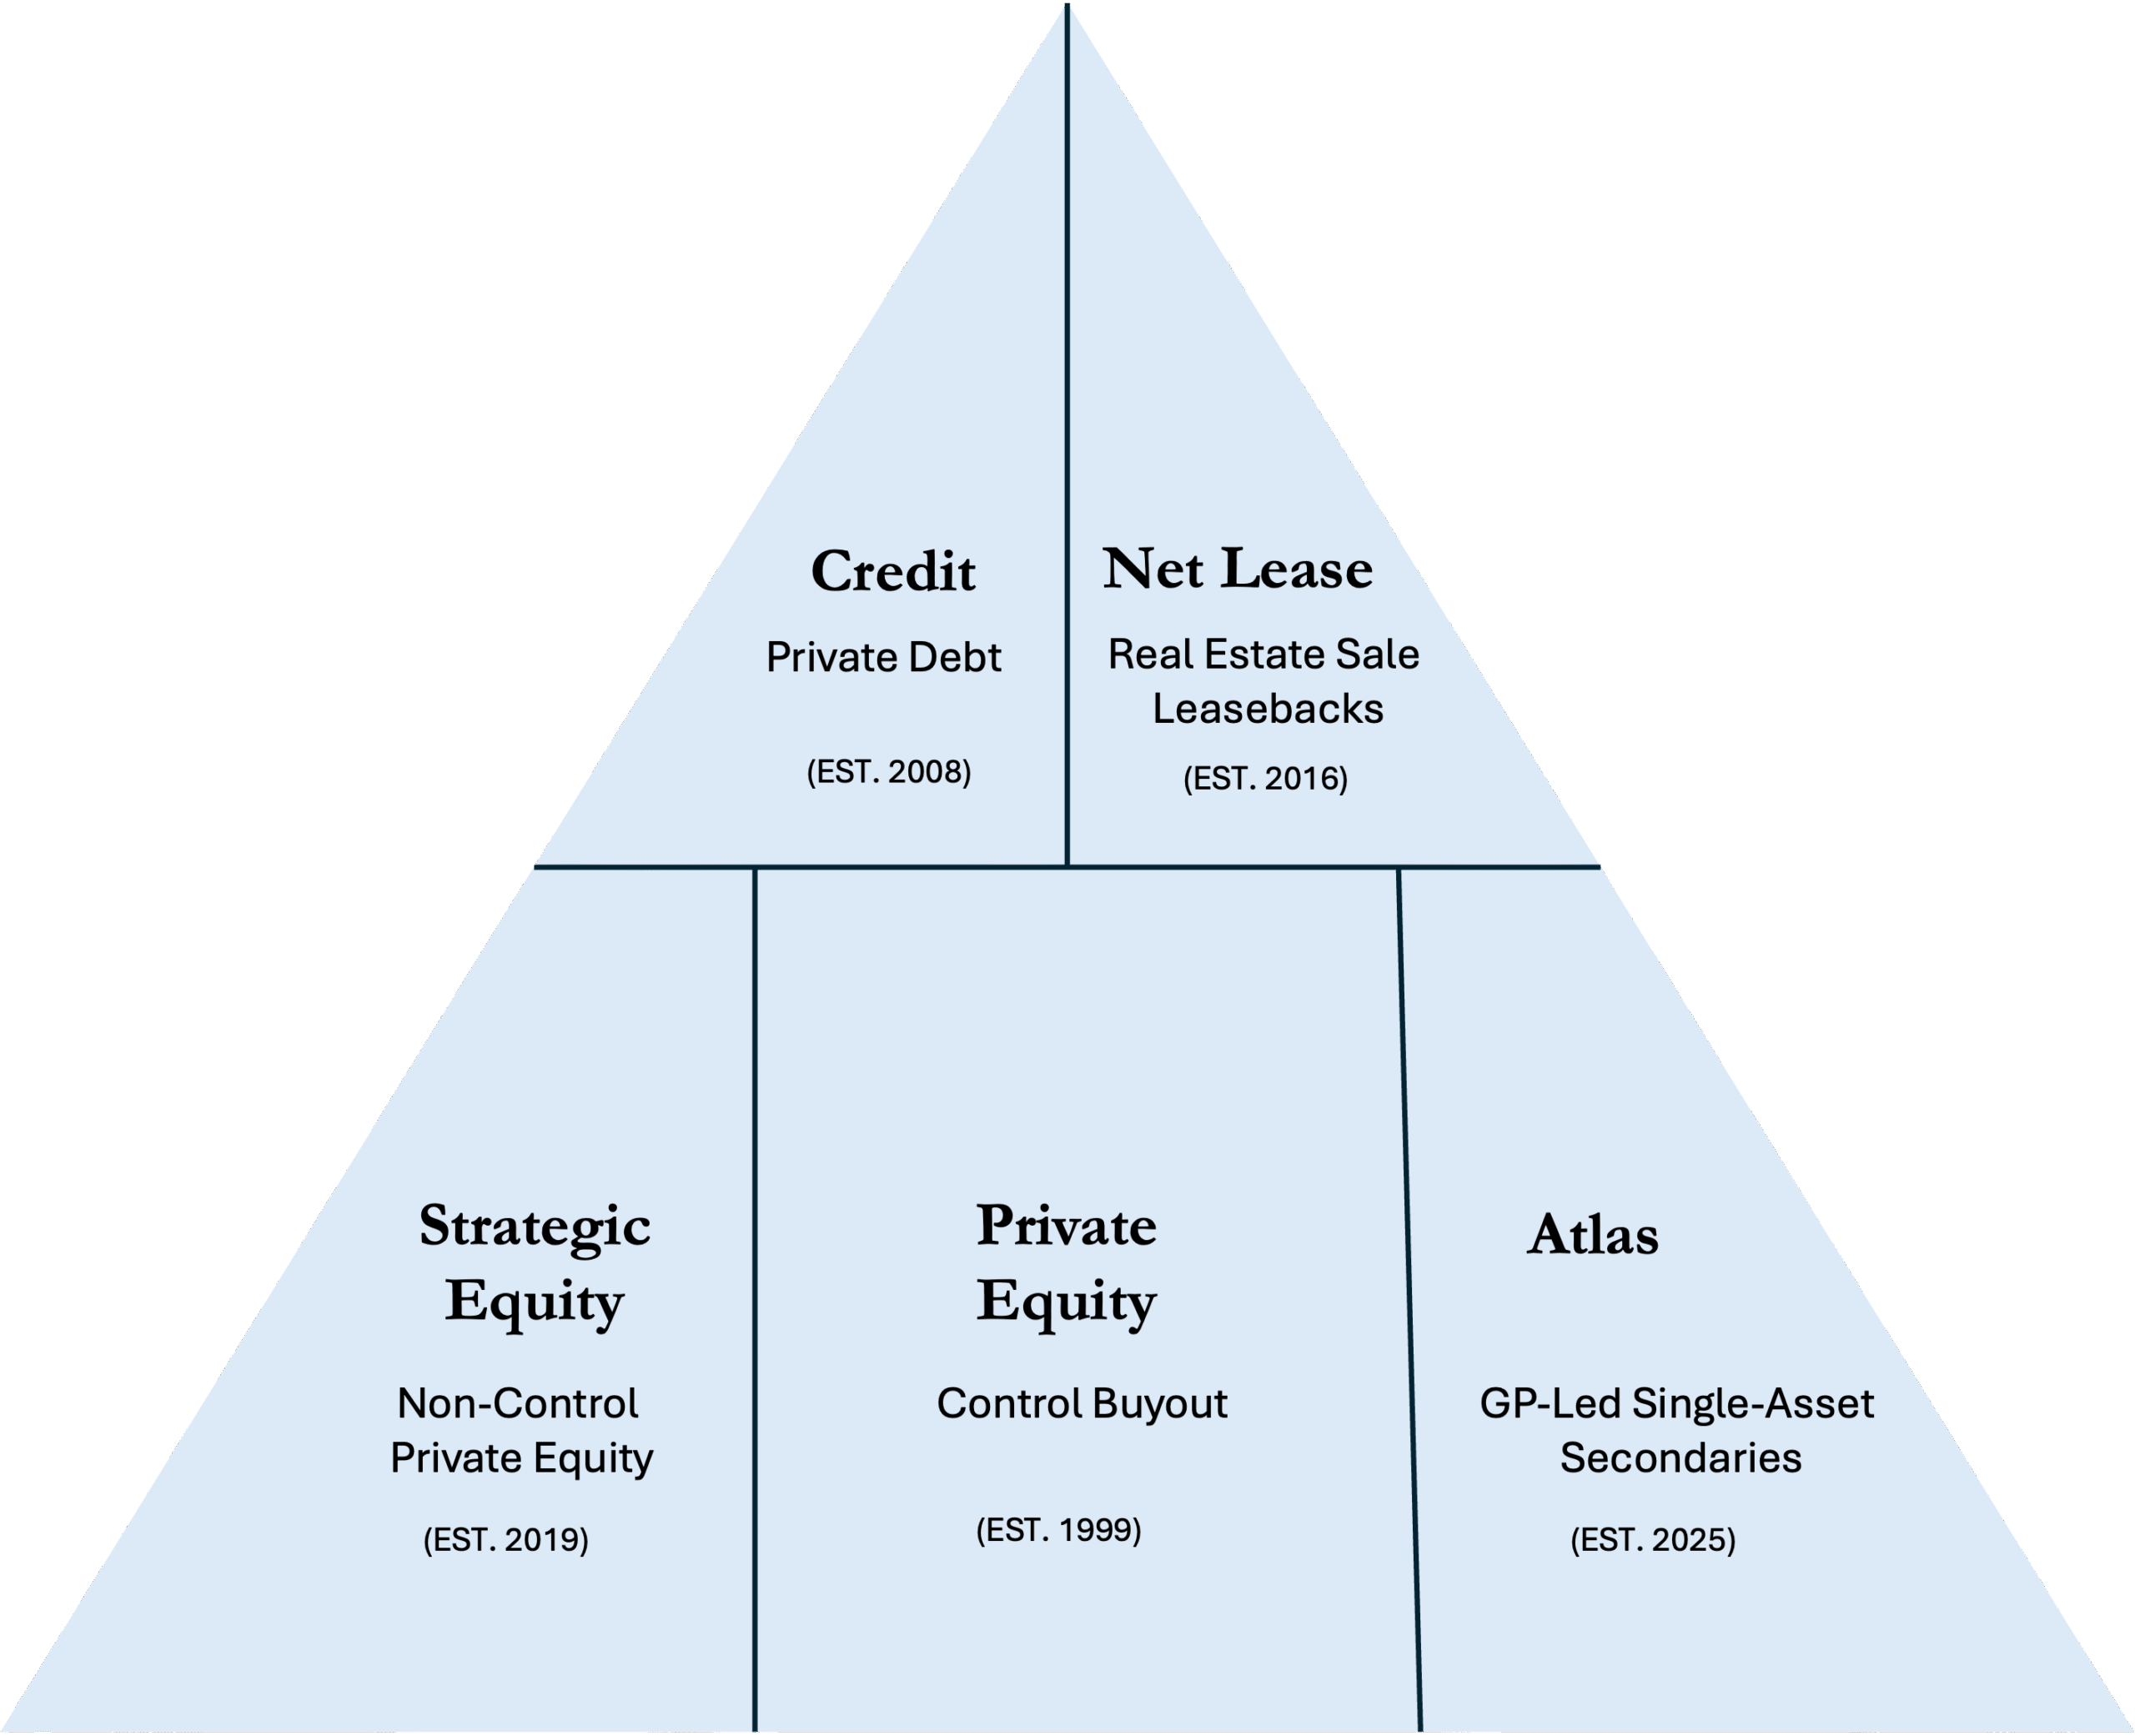
- private equity
- strategic equity
- credit
- net lease

$60bn+
In AUM1 Across:
~300 Investment professionals and staff across the firm
|
50
New Hires |
|
|---|---|
|
23
Transaction Team Members |
7
Operating Executives |
|
9
Business Development & Wealth Solutions professionals |
11
Non-Investment Professionals |
|
60
Promotions & Title Changes2 |
|
|---|---|
|
5
Senior Title Changes |
5
Managing Directors |
|
9
Directors |
7
Vice Presidents |
|
11
Associates & Senior Associates |
23
Non-investment team professionals |
~$3.7bn3 invested in NMP VII portfolio companies
A fleet maintenance provider focused on preventative maintenance, DOT inspections, and repairs for blue-chip commercial vehicle fleets
Comprised of Access Healthcare and Union Healthcare Insight which combine best-in-class services delivery and a strategic consulting & insights platform
Leading independent commercial MGA platform in the U.S., with a 30+ year track-record of strong performance across ~15 specialty insurance programs in the areas of specialty transportation, healthcare, reinsurance, real estate, social services, and other niche B2B end-markets
Leading healthcare technology company that provides comprehensive clearinghouse, claims, and practice management orchestration software for electronic claims processing to providers, payers, and partners across the US healthcare ecosystem
Project “C” is a confidential transaction that NMC signed and closed as of Q4 2025; additional details are forthcoming
Leading US-based provider of tax, accounting, and consulting services for small and midsize businesses and high net worth individuals across a variety of end markets
Producer of a wide range of high-efficacy maintenance and cleaning solutions for commercial, industrial, institutional, and consumer end-markets
A leading U.S. pure-play employee benefits broker with a combination of strategic advisory services, proprietary technology, advanced analytics, compliance support, technical innovations and HR capital management tools
A leading technology-enabled platform providing outsourced field and engineering services for distributed electromechanical infrastructure assets
A leading provider of commercialization solutions to bio-pharma and healthcare companies that combines the precision of AI with marketing and communications expertise to improve healthcare experiences and engagement
Growth Capital
Recapitalization
Strategic M&A
A national advisory and accounting firm serving middle-market organizations, offering a full range of audit, tax and consulting solutions across industries and geographies.
Defensive Growth Focus
Sponsor-backed Direct Lending
Flexible Mandate
Strong Research / Underwriting Model
~$33bn
Invested across
credit strategy11
17-year Track record since inception
450 Unique borrowers12
Guardian IV Complex Fully Invested
Continued Emphasis on Establishing Customized Mandates with Institutional Partners
2 New CLO Issuances
Expanding Efforts Focused on High-Net-Worth Channel
Anaplan is a leading provider of cloud-based connected planning software, primarily serving enterprise clients across functional workflows such as finance, sales, supply chain, and personnel management
Lyons Magnus, Inc. is an industry leading developer, manufacturer and marketer of fruit and flavor solutions for the Foodservice, Healthcare and Industrial Dairy channels.
RESA Power is a leading provider of onsite services and solutions for substations and other electrical equipment
Tenant Credit

Asset Criticality to Business

Real Estate Fundamentals

AUM14
Invested since inception15
square feet16
Properties
Tenants17
States /
Provinces18
Occupancy19

[1] Includes asset valuations and remaining commitments (if applicable) as of September 30, 2025.
[2] Includes promotions and title changes made in August 2025 and January 2026.
[3] Inclusive of LP co-investment closed. Note that Amerit was signed in December 2024 and closed in February 2025. Project C signed and closed in Q4 2025.
[4] Inclusive of add-ons funded by balance sheet capital, debt, and fund equity.
[5] As of 12/31/2024.
[6] Includes jobs through organic growth and acquisitions under New Mountain’s ownership.
[7] NMC median is the weighted average of the median compensation at each New Mountain portfolio company. U.S. median and average are from the Census Bureau survey based on 2023 data (the latest data available as of our report date).
[8] Enterprise value gains is calculated based on change in enterprise value and is adjusted for acquisitions where additional fund equity was used and other transformative transactions; as of 12/31/2024.
[9] New Mountain estimates that it has created over $1.4 billion of value for employees at portfolio companies sold since 2018 (not including value for board of directors and C-suite executives of those companies). The total value would be significantly larger if we included companies sold by New Mountain prior to 2018 (before the statistic was tracked) and companies that we still hold.
[10] Includes asset valuations and remaining commitments (if applicable) for NMFC, the SLPs, Guardian II, NEWCRED, Guardian IV, Guardian IV Income, H-1 Credit Fund, SLF I, I-1, and the CLOs as of September 30, 2025.
[11] $ invested across New Mountain’s credit platform from inception in October 2008 to September 30, 2025.
[12] Represents unique assets across the New Mountain Direct Lending Platform as of September 30, 2025.
[13] The select investments presented on this page represent the largest investments (by dollars invested) in 2025 made across New Mountain’s Direct Lending Strategy.
[14] Includes asset valuations and remaining commitments (if applicable) for all vehicle across the New Mountain Net Lease platform held as of December 31, 2025, pro forma deals under contract.
[15] Based on asset purchase price from inception to December 31, 2025. Pro Forma deals under contract.
[16] Square feet managed, pro forma deals under contract, from inception to December 31, 2025.
[17] Pro forma deals under contract.
[18] Includes asset located in North America, this does not include facilities owned in Europe. Pro forma deals under contract.
[19] “Occupancy” represents the quotient of (1) the total square footage of our properties minus the square footage of our properties that are vacant and from which we are not receiving any rental payment, and (2) the total square footage of our properties as of December 31, 2025.